How Holistic is Your Portfolio?
- Magnus Ytterstad

- Mar 11, 2021
- 1 min read
Updated: Nov 29, 2022
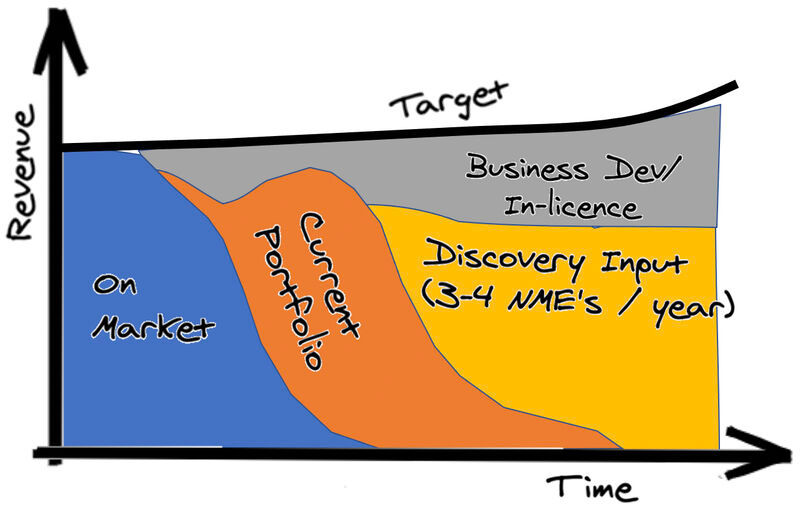
A pharmaceutical pipeline consists of four parts:
On-market products: These are easy to forecast since the company already has a pretty good idea of the sales trajectory for products on the market.
Clinical products under development: These are what most would consider "the portfolio" in R&D.
Discovery input: These are future clinical products currently in discovery and at least 6-10 years from launch.
Business development input: This consists of in-licensing, partnerships, and other collaborative efforts.
Representing the entire portfolio in one holistic system gives a complete picture and reveals gaps in meeting a revenue target over time. It will also show governance bodies how different business units contribute to meeting projected targets.
Here's one example visualizing each part. How do you visualize your portfolio?


Comments